

A PRISMA 2020 flow diagram is internally consistent when each reported stage reconciles with the stages immediately before and after it. In this fictional dual-pipeline example, 1,234 database/register records minus 254 duplicates plus 56 records found by other methods yields 1,036 screened records; every later subtraction also reconciles.
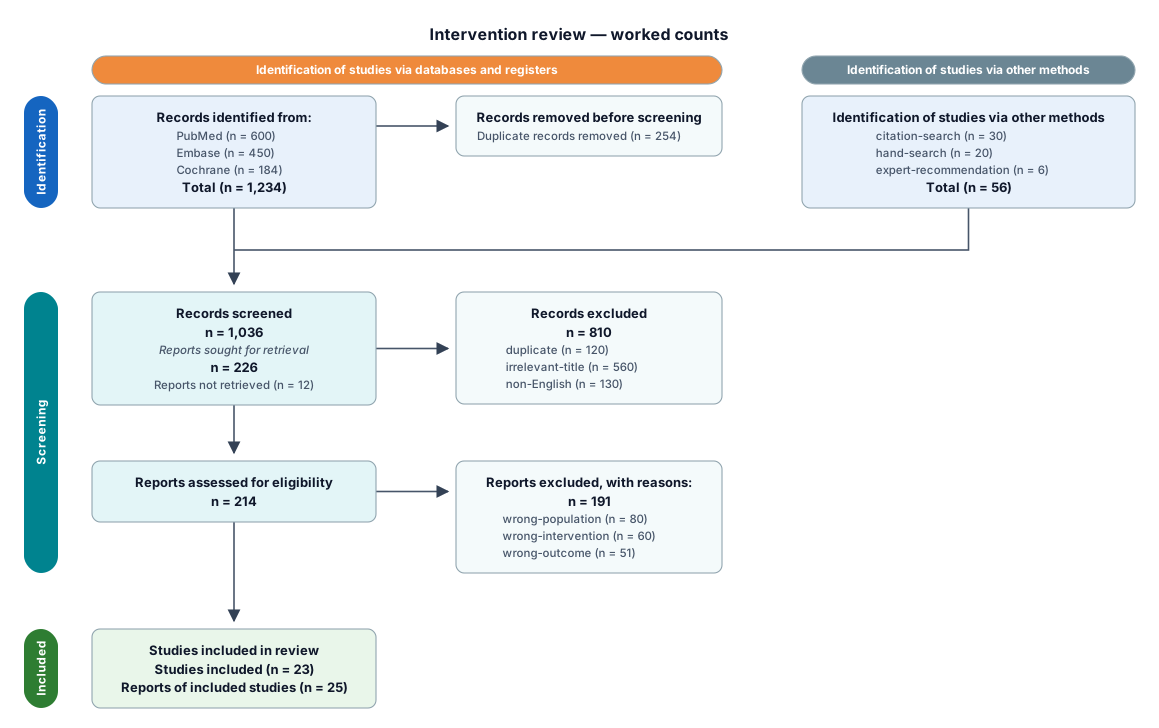
The five reconciliation checks
1. Records entering screening
database records − duplicates removed + other-method records
= 1,234 − 254 + 56
= 1,036 records screened
The “other methods” path includes citation searching, hand searching, and expert recommendations in this example. It remains a separate identification stream before merging into screening.
2. Reports sought for retrieval
records screened − records excluded
= 1,036 − 810
= 226 reports sought
The record/report distinction matters. Screening commonly operates on titles and abstracts represented as records; retrieval and eligibility operate on reports.
3. Reports assessed for eligibility
reports sought − reports not retrieved
= 226 − 12
= 214 reports assessed
If reports not retrieved are omitted from the diagram, the assessed count can appear inexplicably smaller than the sought count.
4. Included studies
reports assessed − reports excluded
= 214 − 191
= 23 studies included
This simplified example maps the 23 remaining eligible reports to 23 included studies. In a real review, report-to-study linkage must be handled explicitly because one study can generate multiple reports.
5. Exclusion-reason subtotal
wrong population + wrong intervention + wrong outcome
= 80 + 60 + 51
= 191 reports excluded| Check | Inputs | Expected | Reported | Result |
|---|---|---|---|---|
| Enter screening | 1234 − 254 + 56 | 1,036 | 1,036 | Pass |
| Seek reports | 1036 − 810 | 226 | 226 | Pass |
| Assess reports | 226 − 12 | 214 | 214 | Pass |
| Include studies | 214 − 191 | 23 | 23 | Pass within stated mapping |
| Reasons subtotal | 80 + 60 + 51 | 191 | 191 | Pass |
Why studies can differ from reports
PRISMA 2020 distinguishes studies from reports. One randomized trial may produce a protocol, primary results paper, follow-up paper, and subgroup analysis. Those are multiple reports of one study.
The fictional diagram therefore reports 23 studies and 25 reports. That is not an arithmetic error. It is a reminder that the included-stage relationship is not always a one-to-one subtraction from eligible reports. A robust review workflow maintains a study–report linkage table rather than guessing from citation titles.
Reproducible input
prisma
mode: 2020-dual
identification:
  databases:
    n: 1234
    duplicates-removed: 254
  other:
    n: 56
screening:
  records-screened: 1036
  excluded: 810
  reports-sought: 226
  reports-not-retrieved: 12
eligibility:
  full-text-assessed: 214
  excluded: 191
included:
  studies: 23
  reports: 25
Schematex’s complete DSL additionally records source and exclusion-reason breakdowns, as used in the rendered figure.
A validator should flag contradictions, not silently repair them
If the user reports 1,050 screened records while the identification arithmetic produces 1,036, a renderer has three possible behaviors:
- silently trust the reported total;
- silently recompute and replace it;
- render only after exposing the contradiction.
The third behavior preserves provenance. Silent correction creates a polished diagram that no longer matches the review dataset; silent acceptance creates a polished inconsistency. A useful error should name the two conflicting fields and show the expected equation.
Which official template applies?
The PRISMA Executive publishes templates for new and updated reviews, each with database/register-only and database/register-plus-other-method variants. This worked example uses the latter dual-pipeline form for a new review. An updated review needs the corresponding previous-studies pathway rather than a relabeled new-review figure.
The Schematex PRISMA reference documents the supported modes and vocabulary. The official PRISMA flow-diagram page remains the authority for selecting and citing the reporting template.